Franklin Street Properties Corp. 2013 Annual Report
Financial Highlights
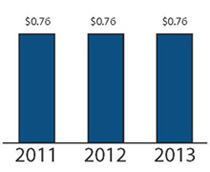
Dividends Paid (per share)
as of December 31
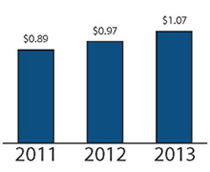
Funds from Operations
(FFO)* (per share)
as of December 31
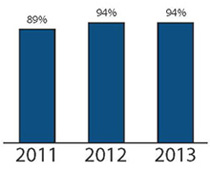
Leased Percentage
as of December 31
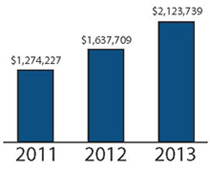
Total Market Capitalization
(TMC)**
as of December 31
Balance Sheet Data - Year Ended December 31
(In thousands, except per share amounts)
| 2011 | 2012 | 2013 | |
|---|---|---|---|
| Total assets | $1,407,348 | $1,526,068 | $2,044,034 |
| Total liabilities | $485,981 | $661,319 | $993,868 |
| Total shareholders’ equity | $921,367 | $864,749 | $1,050,166 |
| Shares outstanding at year-end | 82,937 | 82,937 | 100,187 |
| Shareholders’ equity per share | $11.11 | $10.42 | $10.48 |
| Dividends paid for the year ended December 31 | $62,177 | $63,032 | $69,588 |

* FFO is a non-GAAP financial measure currently used in the real estate industry that we believe provides useful information to investors. Please refer to page A-1 of this Annual Report for a definition of FFO and a reconciliation of net income to FFO.
** The Company calculates Total Market Capitalization as the sum of the closing share price for the date of the calculation multiplied by the number of shares outstanding on the date of the calculation, plus the sum of debt outstanding on the date of the calculation.