Franklin Street Properties Corp. 2014 Annual Report
Financial Highlights
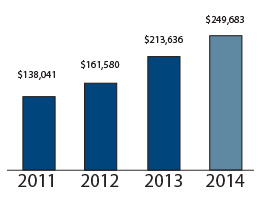
Total Revenue
as of December 31
(in thousands)
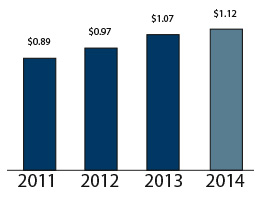
Funds from Operations (FFO)**
as of December 31
(per share)
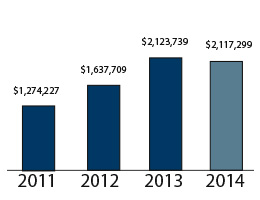
Total Market Capitalization (TMC)*
as of December 31
(in thousands)
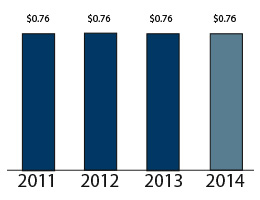
Dividends Paid
as of December 31
(per share)
Balance Sheet Data - Year Ended December 31
(In thousands, except per share amounts)
| 2011 | 2012 | 2013 | 2014 | |
|---|---|---|---|---|
| Total assets | $1,407,348 | $1,526,068 | $2,044,034 | $1,936,390 |
| Total liabilities | $485,981 | $661,319 | $993,868 | $956,743 |
| Total shareholders’ equity | $921,367 | $864,749 | $1,050,166 | $979,647 |
| Shares outstanding at year-end | 82,937 | 82,937 | 100,187 | 100,187 |
| Shareholders’ equity per share | $11.11 | $10.42 | $10.48 | $9.78 |
| Dividends paid for the year ended December 31 | $62,177 | $63,032 | $69,588 | $76,142 |
*The Company calculates Total Market Capitalization as the sum of the closing share price for the date of the calculation multiplied by the number of shares outstanding on the date of the calculation, plus the sum of debt outstanding on the date of the calculation.
**Includes Non-GAAP Financial Measures which are defined and reconciled to net income and can be found on Page A-1, which is the last page of this Annual Report.